Climate negotiations and the 2°C target
The climate negotiations in December in Paris will be the funeral of the 2°C target (Doyle and Wallace 2015). It will be an expensive funeral, with tens of thousands of mourners in attendance. The Paris proceedings will re-open the question: How bad is it if the world would warm by more than 2°C over pre-industrial times?
The 2°C target was never attainable. The Stanford Energy Modelling Forum commented on its infeasibility in 2009 (Clarke et al. 2009). The Intergovernmental Panel on Climate Change qualified that conclusion, noting that we might just get there if we would use bioenergy with carbon capture and storage on a large scale (Clarke et al.2014). That is a big ‘if’. It will be a long time before bioenergy with carbon capture and storage can be deployed at a reasonable cost. Indeed, recent developments in shale oil and gas have severely hampered the competiveness of renewable energy.
The international climate negotiations have moved away from their futile attempts to reach a cooperative solution (Barrett 1994). Instead, a more realistic pledge-and-review architecture is slowly emerging (Bradford 2008). All the big players – China, the EU, India, Japan and the US – have announced their emission reduction targets well in advance of the Paris meeting, leaving little to negotiate over. Adding up these so-called Intended Nationally Determined Contributions confirms that whatever the political rhetoric may be, no country is seriously trying to keep warming to 2°C (Jeffery et al. 2015). How bad is that?
Global economic impact of climate change
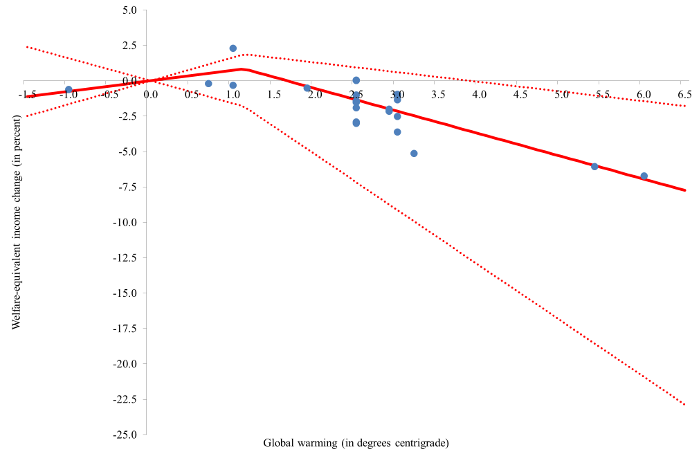
The impacts of climate change are many and diverse. Aggregate indicators, such as the total welfare impact, give an idea of the size of the climate problem, but, of course, hide many details. Figure 1 shows the 27 published estimates of the total economic impact of climate change (Tol 2015). The numbers should be read as follows. A global warming of 2.5ºC would make the average person feel as if she had lost 1.3% of her income, 1.3% being the average of the 11 estimates at 2.5ºC. These estimates were derived using a range of well established and accepted methods, the complaints of Pindyck (2013) notwithstanding.
Figure 1. The global total annual impact of climate change expressed in welfare-equivalent income change as a function of the rise in the global annual mean surface air temperature since pre-industrial times

Note: The dots are the primary estimates, the solid line the best-fit piecewise linear function, and the dotted lines denote the 95% confidence interval.
Twenty-seven estimates is a thin basis for any conclusion. Researchers disagree on the sign of the net impact; climate change may lead to a welfare gain or loss. At the same time, researchers agree on the order of magnitude. The welfare change caused by climate change is equivalent to the welfare change caused by an income change of a few percent.
That is, a century of climate change is about as good/bad for welfare as a year of economic growth.
Initial warming is positive on net, while further warming would lead to net damages. The initially positive impacts do not imply that greenhouse gas emissions should be subsidised. The incrementalimpacts turn negative at around 1.1ºC global warming, which cannot be avoided. The initial net benefits of climate change are sunk.
The solid line in Figure 1 is the least-squares piecewise linear model. Other impact functions do not fit the data at all, particularly the highly non-linear functions suggested by Weitzman (2011) and Golosov et al. (2014).
The uncertainty is large. The 95% confidence interval in Figure 1 may be an underestimate of the true uncertainty, as experts tend to be overconfident and also the 27 estimates were derived by a group of researchers who know each other well. Taking the confidence interval at face value, the impact of climate change does not significantly deviate from zero until 3.5°C warming. The uncertainty is right-skewed. Negative surprises are more likely than positive surprises of similar magnitude, but still, a century of climate change is no worse than losing a decade of economic growth.
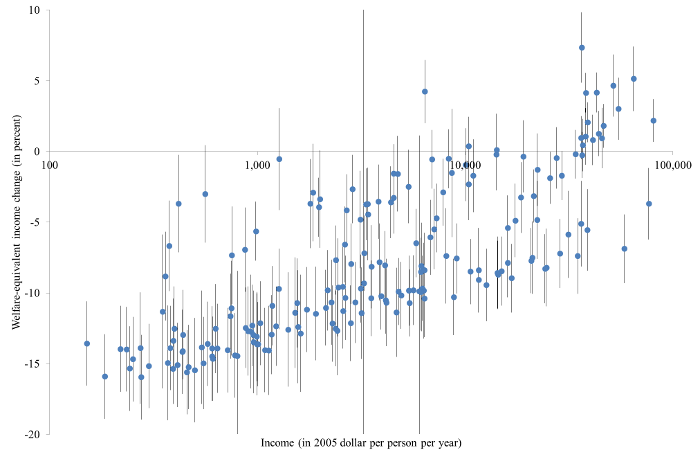
Figure 2 shows the expected impacts by country for a global warming of 2.5˚C (Tol 2015). Countries are ranked from low to high per capita income (in 2005). The majority of countries show a more negative impact than the global average. This is because the world economy is concentrated in a few rich countries.
Figure 2. Climate change in welfare-equivalent income change for a 2.5°C global warming

Note: The national total annual impact of climate change is expressed in welfare-equivalent income change for a 2.5˚C global warming (relative to pre-industrial times) as a function of per capita income.
The disproportional vulnerability of developing countries
By and large, the negative impacts of climate change will fall on developing economies. There are three reasons for the disproportional vulnerability of developing countries.
First, poorer countries are more exposed.
Richer countries have a larger share of their economic activities in manufacturing and services, which are typically shielded (to a degree) from the vagaries of weather and hence climate change. Agriculture and water resources are far more important, relative to the size of the economy, in poorer countries.
Second, poorer countries tend to be in hotter places.
This means that ecosystems are closer to their biophysical limits, and that there are no analogues for behaviour and technology.
Third, poorer countries often lack access to modern technology and institutions that can help protect against the weather, such as air conditioning, malaria medicine, and crop insurance.
Poorer countries may lack the ability, and sometimes the political will, to mobilise the resources for large-scale infrastructure – irrigation and coastal protection, for example.
There are two ways to mitigate the excessive impact of climate change on the poor: reduce climate change, and reduce poverty. A fifth of official development aid is now diverted to climate policy (Tol 2014). Access to energy is a key part of development. Coal is the cheapest way to make electricity, but emits most carbon dioxide. Overly ambitious climate policy may make the impacts of climate change worse rather than better.
Conclusion
In sum, breaking the 2ºC target is not a disaster. The most serious impacts are symptoms of poverty rather than climate change. Other impacts are unlikely to have a substantial effect on human welfare.
References
Barrett, S (1994), “Self-Enforcing International Environmental Agreements”, Oxford Economic Papers, 46: 878-894.
Bradford, D F (2008), “Improving on Kyoto: Greenhouse Gas Control as the Purchase of a Global Public Good”, In R Guesnerie, & H Tulkens (Eds.), The Design of Climate Policy: 13-36. Cambridge: MIT Press.
Clarke, L, J Edmonds, V Krey, R Richels, S Rose and M Tavoni (2009), “International climate policy architectures: Overview of the EMF 22 international scenarios”, Energy Economics, 31(S2): S64-S81.
Clarke, L, K Jiang, K Akimoto, M H Babiker, G J Blanford, K A Fisher-Vanden, J C Hourcade, V Krey, E Kriegler, A Loeschel, D W McCollum, S Paltsev, S Rose, P E Shukla, M Tavoni, D van Vuuren, and B Van Der Zwaan (2014), “Assessing Transformation Pathways”, In O Edenhofer, R Pichs-Madruga, and Y Sokona (Eds.), Climate Change 2014: Mitigation of Climate Change – Contribution of Working Group III to the Fifth Assessment Report of the Intergovernmental Panel on Climate Change, Cambridge: Cambridge University Press.
Doyle, A, and B Wallace (2015), “U.N. climate deal in Paris may be graveyard for 2C goal”, Reuters.
Golosov, M, J Hassler, P Krusell, and A Tsyvinski (2014), “Optimal Taxes on Fossil Fuel in General Equilibrium”, Econometrica, 82(1): 41-88.
Jeffery, L, R Alexander, B Hare, M Rocha, M Schaeffer, N Höhne, H Fekete, P van Breevoort, and K Blok (2015), “How close are INDCs to 2 and 1.5°C pathways?”, Update, Vol. September. Potsdam: Climate Action Tracker.
Pindyck, R S (2013), “Climate change policy: What do the models tell us?” Journal of Economic Literature, 51(3): 860-872.
Tol, R S J (2014), Climate economics: Economic analyses of climate, climate change, and climate policy, Cheltenham: Edward Elgar.
Tol, R S J (2015), “Economic impacts of climate change”, Working Paper. Falmer.
Weitzman, M L (2011), “Fat-tailed uncertainty in the economics of catastrophic climate change”,Review of Environmental Economics and Policy, 5(2): 275-292.
This article is published in collaboration with VoxEU. Publication does not imply endorsement of views by the World Economic Forum.
To keep up with the Agenda subscribe to our weekly newsletter.
Author: S J Tol is Professor of Economics at the University of Sussex and Professor of the Economics of Climate Change at Vrije Universiteit Amsterdam.
Image: A Bozo fisherman casts his net from a pirogue in front of Saaya village in the Niger river inland delta. REUTERS/Florin Iorganda